
How to Sell Your Memory Stocks like San Disk at the Top (Using AI)
I built an AI dashboard to call the top. Here's what it sees.

PS - I’m combining my two newsletter “Singularity Research” which focused on Data Center stocks and “AI tools for investing” which focused on leveraging AI to make better investment decisions into one newsletter. I have merged both the email list and no change required from your end.
Every memory investor owning San Disk SNDK 0.00%↑, Micron MU 0.00%↑, Samsung, SK Hynix etc. I talk to is asking the same question: how much longer can memory stocks keep running, and how do I get out before the turn?
Their questions are valid. Most of the revenue growth in this cycle isn’t coming from volume. It’s coming from price. That is exactly what late-cycle memory has historically looked like - massive price hikes, followed by oversupply, price correction and everything turning violent. Memory cycles do not gently roll over. They snap.
The real question isn’t if the cycle turns. It’s whether you’ll see it before the crowd does. I’ve spent the last few days building an AI workflow to do exactly that. Here’s what I landed on.
The Tool I Picked (and Why the Chinese Models Disappointed Me)
I tested Perplexity, Qwen, DeepSeek, and Claude for this specific use case. I included Qwen and DeepSeek deliberately. My hypothesis was that the Chinese models might surface data or reporting the Western models would miss, given how much of the memory supply chain runs through Asia. But it was not the case.
The Chinese models didn’t add the edge I was hoping for. I prompted in English and my theory is that when you prompt in English, the models query English websites and returns English-language results only. There might be alpha sitting in local-language websites. Explicitly asking the model to search local websites and publications might help surface those results. I explored this idea in a previous piece:
Could Citrini's Analyst #3 use AI to reach the Similar Conclusions

In Citrini’s latest piece, “Strait of Hormuz: A Citrini Field Trip,” analyst #3 takes a field trip to the Strait of Hormuz. But here’s the question I want to explore: how close can you get to insights that analyst #3 was looking for from your desk using AI? That’s what this post is about. I’ll walk through the exact tools, prompts, and workflows how I would use to try to answer the hypothesis, so you can try them yourself.
Between perplexity and Claude: Claude was clearly the best for this workflow. Its citations are tight, it’s willing to dig into SEC filings and earnings transcripts, and it doesn’t hallucinate quotes the way the others sometimes do. It also double checked all the data points when prompted and updated itself using official Government sources unlike perplexity.
With a clear llm winner for my memory dashboard, I built two complementary workflows: one qualitative, one quantitative.
Workflow 1: Track the Industry Chatter (With Receipts)
The first workflow is simple but disciplined: every few days to every couple of weeks, I ask Claude to surface exact quotations from CEOs, industry executives, sell-side analysts, SEC filings, and earnings call transcripts on the state of memory.
Specifically: Is supply tight or loosening? Are prices rising or falling? What’s being said about capacity constraints? What’s happening with inventory? Please provide exact quotes with source.
The key discipline: ask for exact quotes with sources, not summaries. Summaries get hallucinated. Direct quotes with citations are auditable.
To date, virtually every quote that has come back has been bullish:
Sanjay Mehrotra (Micron CEO): “DRAM requirement in advanced AI accelerators has now doubled year-over-year. Without more memory, without faster memory, AI just cannot scale up.”
Choi Joon-yong (SK Hynix HBM Head): Projected 30% annual growth in HBM market through 2030, driven by “strong end-user demand for AI capabilities.”
Tight supply. Rising prices. Capacity sold out into 2027.
But there’s one crack in the wall.
Samsung warned in August 2025 that HBM3E supply could outstrip demand growth, hinting at potential near-term oversupply in older-generation stacks. That’s the only bearish signal I’ve found in the entire wall of bullish industry commentary. But we are moving to the next generation of memory chips (HBM4), so we can ignore this.
A practical note on getting better results: A lot of the most valuable commentary lives behind paywalls: sell-side research, niche trade publications, paid newsletters. If you have access to that material, paste it directly into Claude’s context window and let the model cross-reference it against the public data. The model becomes dramatically more useful when you feed it what the open web doesn’t index.
Workflow 2: The Export Data Dashboard That Tracks the Cycle in Near-Real-Time
This is the more powerful of the two workflows, because it gives you a quantitative signal instead of a qualitative one.
Here’s an insight most investors miss: a huge amount of valuable economic information is hiding in plain sight in import/export data, particularly customs data published by Asian governments. I started prompting Claude to find the freshest, highest-frequency data on DRAM, NAND, and HBM shipments, and turned it into a live dashboard.
The data source I converged on: Korean monthly semiconductor export data.
Why Korea? Because roughly 80–85% of South Korea’s total semiconductor exports are memory, and Korea is home to Samsung and SK Hynix, the two largest memory producers on Earth. When Korean semiconductor exports accelerate or decelerate, you’re watching the global memory cycle move in near-real-time, with maybe a two-to-four-week lag.
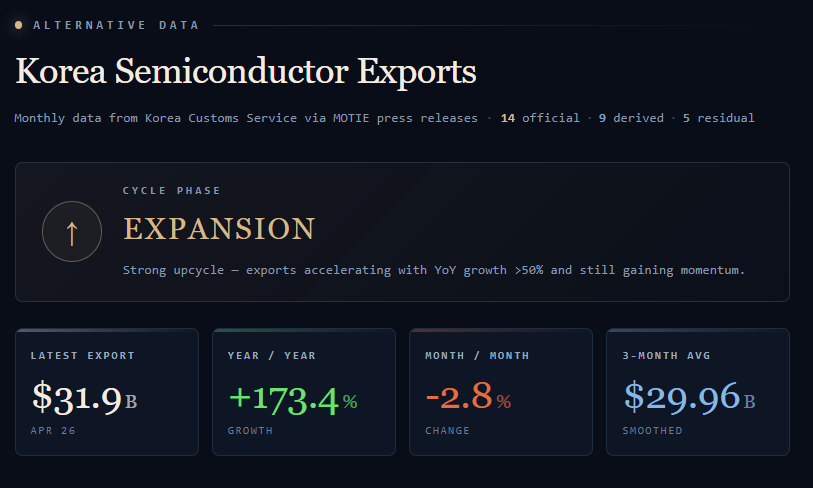
Here’s what the absolute dollar amount and year-over-year growth in semiconductor export value looks like over the most recent months:
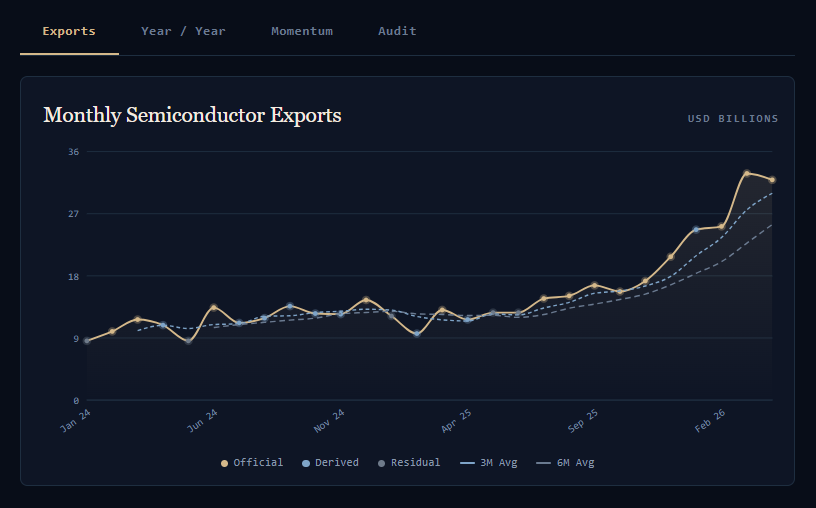
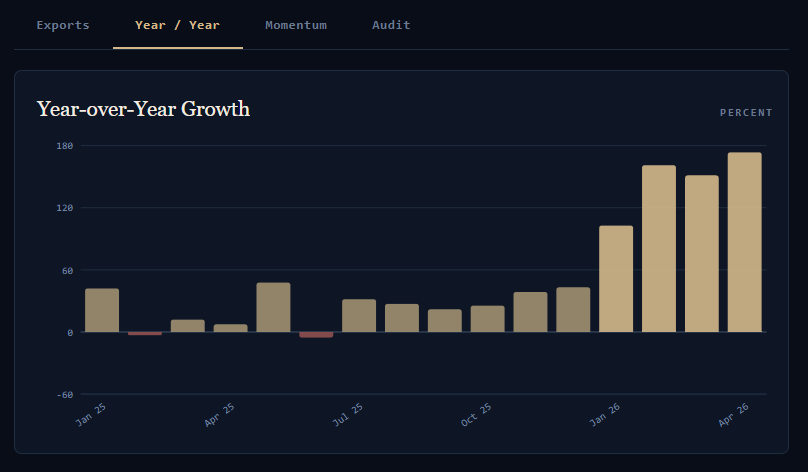
This is not a topping pattern. This is an accelerating curve.
The cycle is still expanding, and the rate of expansion is itself increasing. As of right now, the data says one thing clearly: still in the boom phase of the memory supercycle
Link to the full dashboard
Link to my prompts for creating this dashboard if it interests you
When to sell you memory stock?
The whole point of this exercise is to spot the inflection before the market prices it in.
When the cycle turns, multiple trend lines will start declining simultaneously. The dashboard tracks several key turn signals: moving average crossovers, consecutive months of declining year-over-year growth, month-over-month reversals, and exports falling below their six-month average.
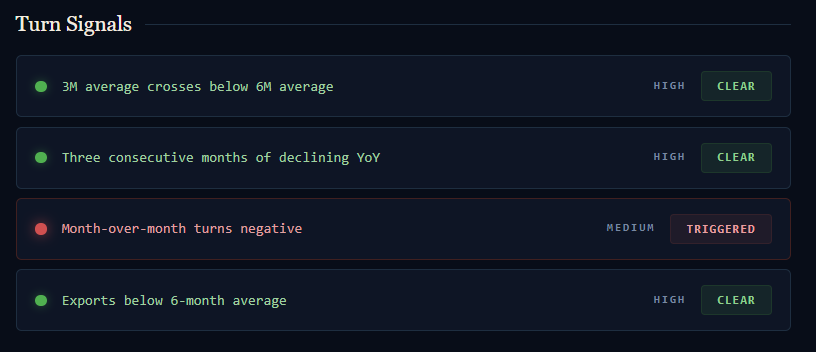
But here’s the critical framework: if the trend lines are declining and industry chatter is bullish, follow the trend lines.
Industry statements might continue the bullish statements for various motivated reasons but data would never lie.
What I’m Building Next
This framework is a strong foundation, but there are clear ways to sharpen it:
Layer in pricing and inventory data. Combining the export numbers with DRAM spot pricing, channel inventory checks, and company guidance would give a much fuller picture of where we are in the cycle.
Go deeper on Asian trade flows. The Korean export data tells you what’s leaving Korea. The next step is tracking where it’s going: more granular import data from China and Taiwan, where the memory ships for GPU and server assembly.
Make it live. Right now, the Claude artifact doesn’t auto-refresh. I’m building a live version for the Singularity Research website so subscribers can watch the same numbers I’m watching, updated in real time, without having to rebuild the workflow themselves.
The Bottom Line
We are currently in the accelerating phase of the memory supercycle. But historically memory cycle cracks
The point isn’t to predict the exact day. Nobody can do that. The point is to build the system now, so that when the data turns, you see it on the first of the month, not three months later when the stocks are already cut in half.
Build the dashboard. Track the quotes. Refresh monthly. That’s the whole edge.
Thanks for reading. Subscribe for free to receive new posts and support my work.
Until next time,
Singularity!
Thank you for posting this. Would you be doing the same thing for optics?
Another question is MOM is declining? What might be the reason? I know you have mentioned multiple indicators but it would be good to map as a Weinstein stages chart so 10w cross 30w would be a clear signal